Introducing Eppo's New Progress Bar
Eppo’s new progress bar gives your team a much-improved tool for understanding your level of certainty.

Table of contents
.svg)
When you’re navigating the uncertainty of designing a new experiment, you want to know two things:
- How long should I run the experiment for?
- When can I confidently make a ship/no-ship decision?
The runtime of an experiment depends primarily on three factors: the sample size (number of users), the variability of metrics you care about (variance), and the size of the effect you want to be able to detect (smaller effects take longer to stand out).
Eppo’s unique sample size calculator helps anyone answer the runtime question precisely, with just a few clicks, by connecting directly to the underlying data and abstracting away all the statistical complexity.
But once your experiment starts, and you begin gathering data, you’ll want an index of how much data you need to gather in order to make a decision. In particular, when you don’t run your experiments long enough, you run the risk of getting fooled by your data — either overestimating the effects, or getting the sign wrong.
So where do you get the confidence to make a good decision?
Most experimentation tools will tell you to focus on the minimum detectable effect (MDE). MDE is the smallest lift that can be detected reliably, while ensuring that the experiment's confidence intervals contain the true value a specified percent of the time.
When planning your experiment, you determine what size a lift you want to be able to detect with a given degree of certainty, and then use a sample size calculator (or power analysis) to understand how long you need to run the experiment.
Making Progress
When Eppo launched our first progress bar feature a year ago, we took the most common approach, and focused on MDE and statistical power.
But we found that despite MDE being a staple of frequentist hypothesis testing lingo, it remains a tricky concept for Data and Product teams to confidently reason about.
In particular, power is a concept that is fundamentally related to an imaginary setting — we imagine the true effect to be the MDE, and then reason about how likely it is that we are able to detect such an effect in an experiment. However, it is difficult to tie that back to our current experiment where we do not know the actual effect.
In addition, many Eppo users use sequential statistics in their analysis, which enables you to adaptively decide when to call your experiment. For example, if you see a statistically significant result early in your experiment, you can decide to roll out the winning variant immediately and still have statistical guarantees. However, the bar for reaching a desired statistical power is higher. This is well known for statisticians, but in practice it gets confusing: the sequential testing framework could be telling you to end the experiment early, while the progress bar would say you should run your experiment longer.
That’s why we’re thrilled to unveil Eppo’s new progress bar, which gives your team a much-improved tool for understanding your level of certainty. It’s a visualization that helps teams quickly understand the status of all your experiments.

Precision > MDE
At Eppo, we have always believed that understanding uncertainty is more important than thinking narrowly about p-values. So with our new progress bar, we are focusing on confidence intervals, not hypothesis tests.
Precision is a measure of the width of your confidence interval. If you are seeking 5% width, then our progress bar will tell you how much more data you need to gather to approach that level of precision. This intuitively measures the uncertainty in the estimates of the experiment effects.
If you’re testing a new feature, and you want to know its impact on revenue within a percentage point, precision will give you very tight control over that measurement.
We’ve heard from Product Managers who say they’re running an experiment with an MDE of 5%, but they don’t know what that means, or don’t have a good baseline. So they make a guess.
Precision is not a guess. Regardless of outcome, it’s how certain you want to be about your result so you can make a ship decision.
This makes setting expectations with stakeholders easier, and can also translate your experimentation impact into a more certain business outcome.
How To Make a Decision
This change is about more than showing the right statistics; it’s about putting your decision-making into the right context, and providing more explicit recommendations.

When you hover over your progress bar, you will better understand your experiment context as you monitor a checklist of three milestones:
- Minimum requirements met (It will monitor minimum sample size and duration — these can be customized)
- Precision target reached
- Desirable statistically significant lift on primary metric
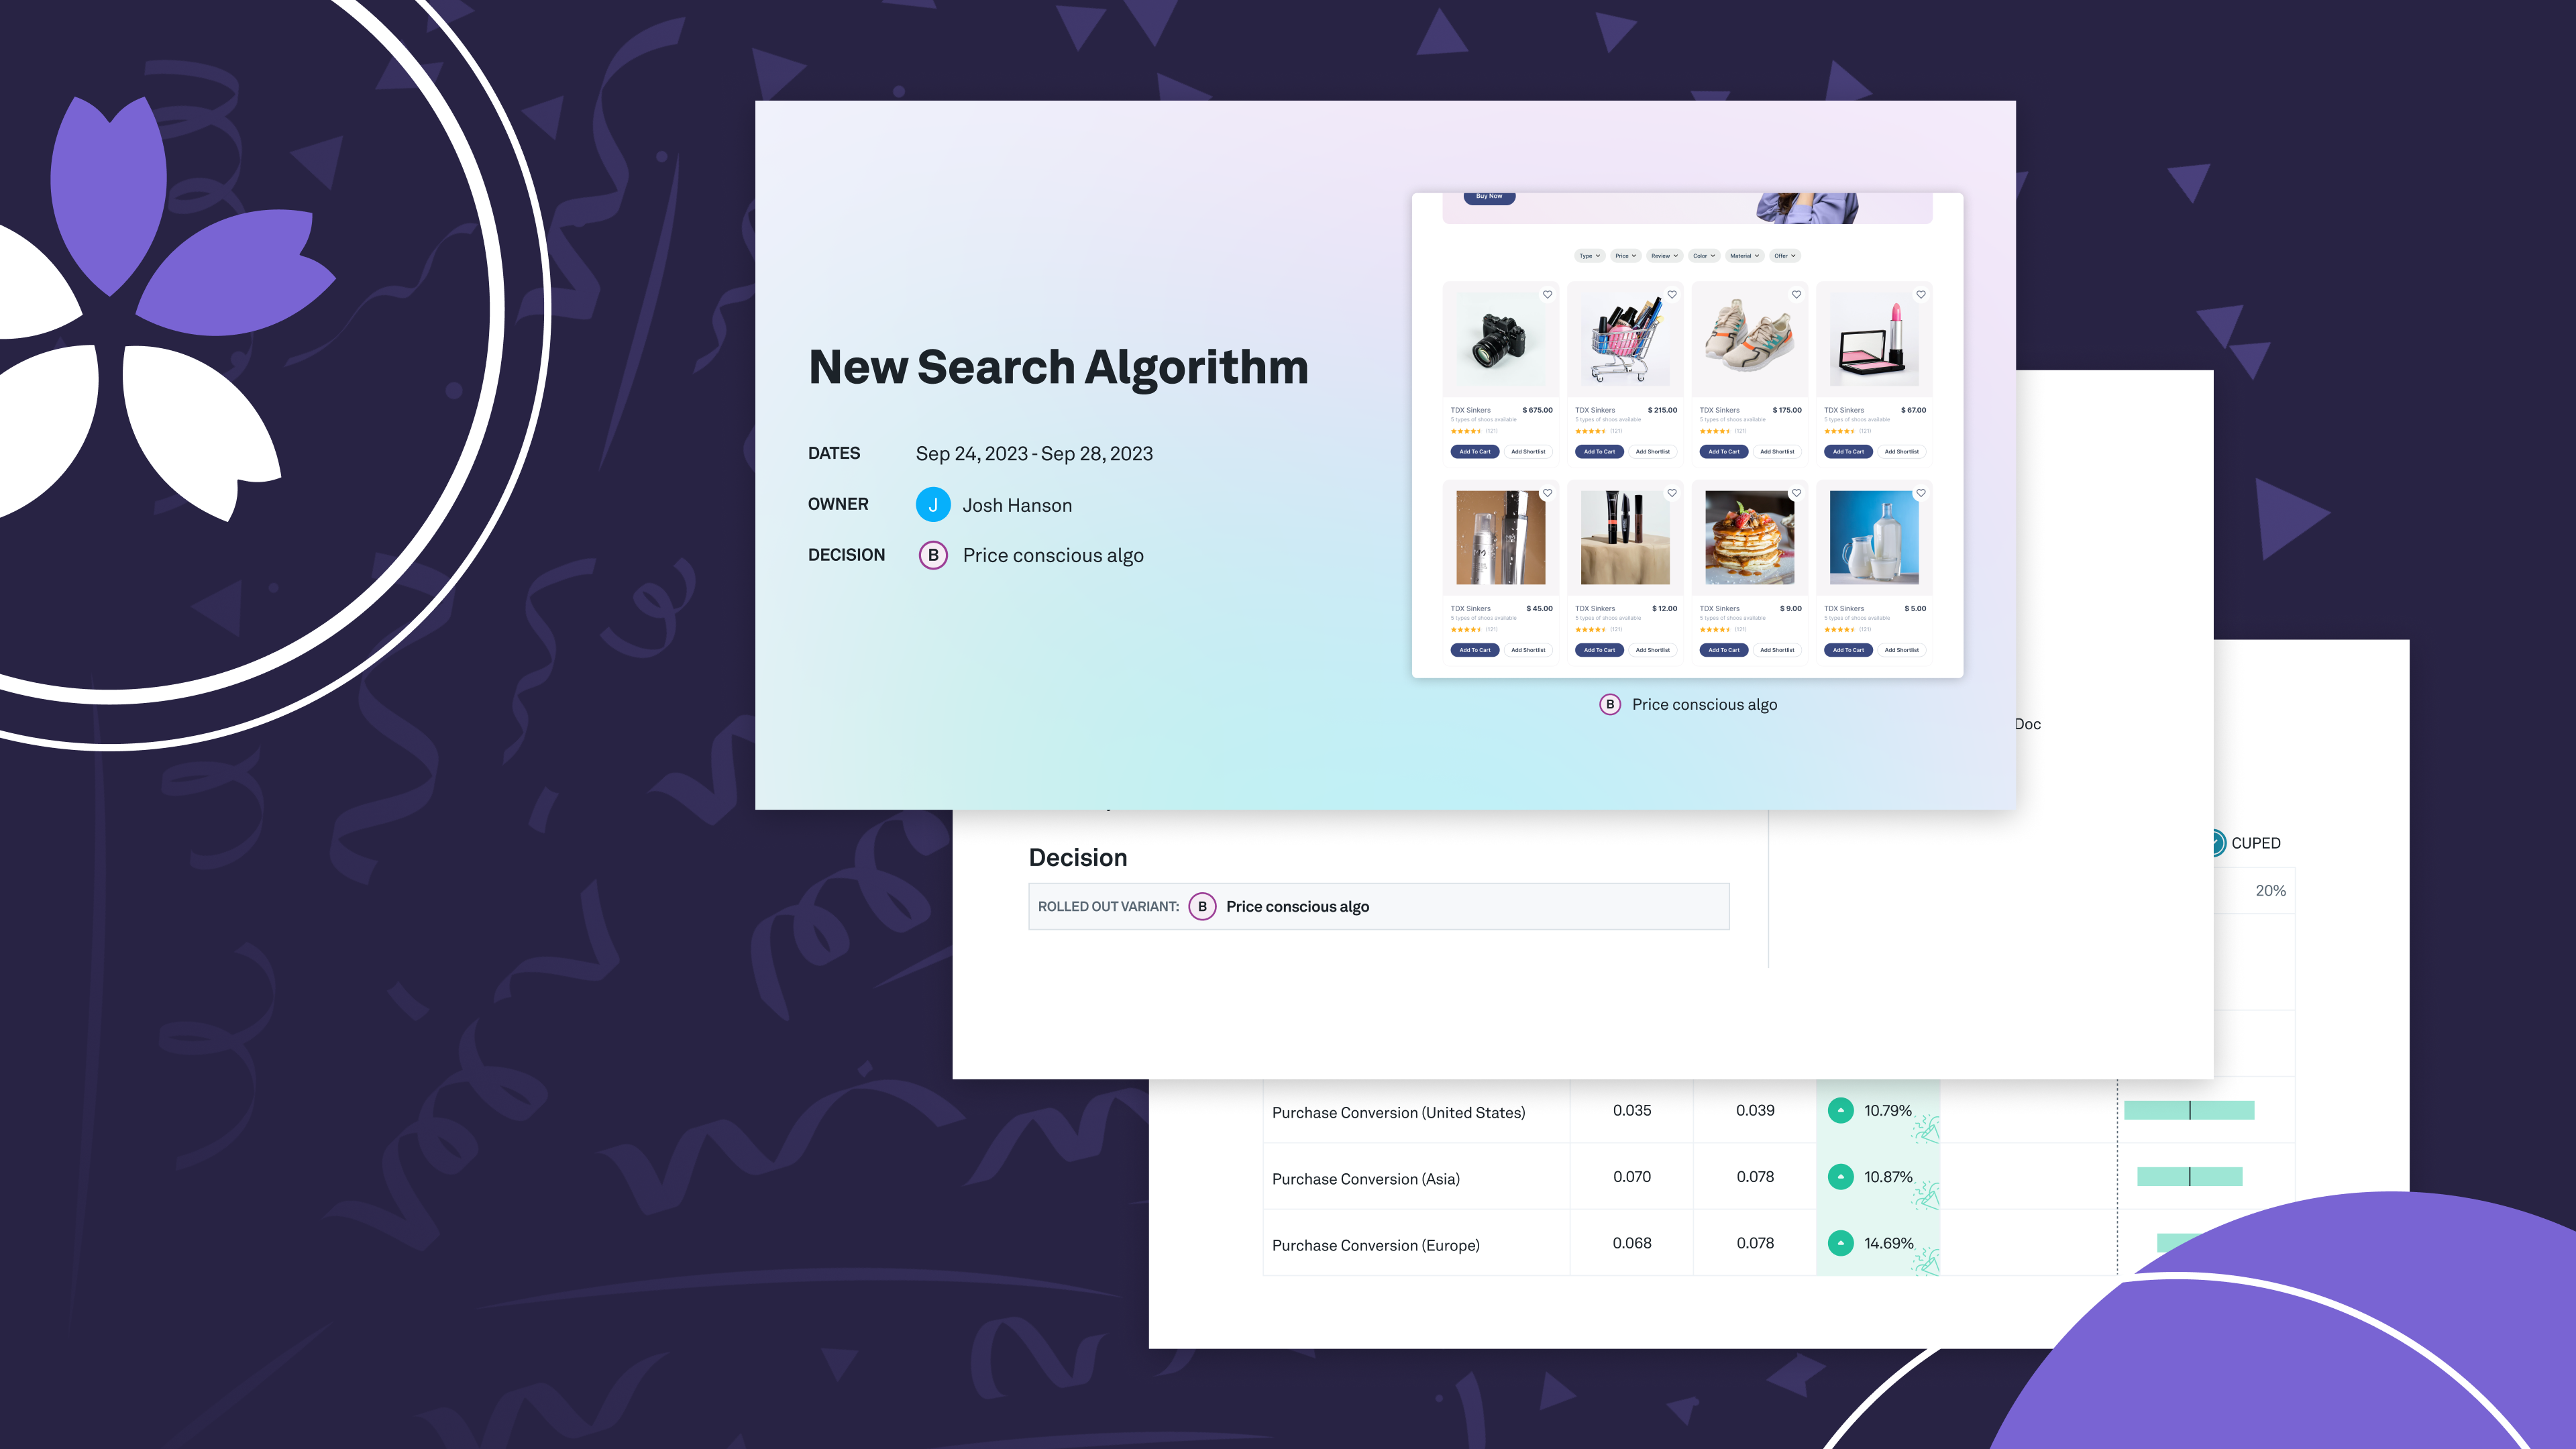
Once you hit that desirable statistically significant lift, “Ready For Review” is your signal that the decision is all yours. (You can also wait for a decision target.) In addition, Eppo will recommend a course of action for that review.
After you take action, your experiment moves into the “Concluded” phase. Eppo will show your target, the experiment conclusion date, and your decision.
Simple, Informative, Delightful
With our new progress bar, we have made the experience of analysis more holistically consistent — it’s more intuitive, accessible, and confidence-inspiring.
From a design standpoint, we opted to create something simple yet informative. Experiment progress should be a shared concern, and as we've mentioned, we found that non-Data Scientists had a hard time wrapping their head around the underlying logic of MDE. By focusing on precision, and uniting teams around an easily understood concept, we are leveraging existing patterns to reduce cognitive overload.
You’ll also notice a pop of confetti 🎊 any time your experiment hits certainty. It’s not simply that we want to bring delight to users. We do — but we also want to bring delight at the most appropriate time. There is no moment worthier of celebration than learning your experiment has a clear winner.
The new progress bar marks a linear journey towards a precision target. We hope it gives your team renewed confidence and clarity.
This feature is now live for all Eppo users, and early reviews are in!

If you have any thoughts or questions as you begin to use it, please do let us know.


.jpg)